Hinweis: Diese Website ist noch in der Beta-Phase - Wir bauen zur Zeit alles auf, aber du kannst bereits deine Apps zum Mitmachen downloaden.
Agnes | SPOTTERON
¿Qué debe aparecer en la foto?
Esto depende del tipo de estación de la cual desea informar: Estación Meteorológica, Estación Hidrológica, Tiempo en Casa o Foto Nota. Mire a continuación las instrucciones para cada tipo de estación:
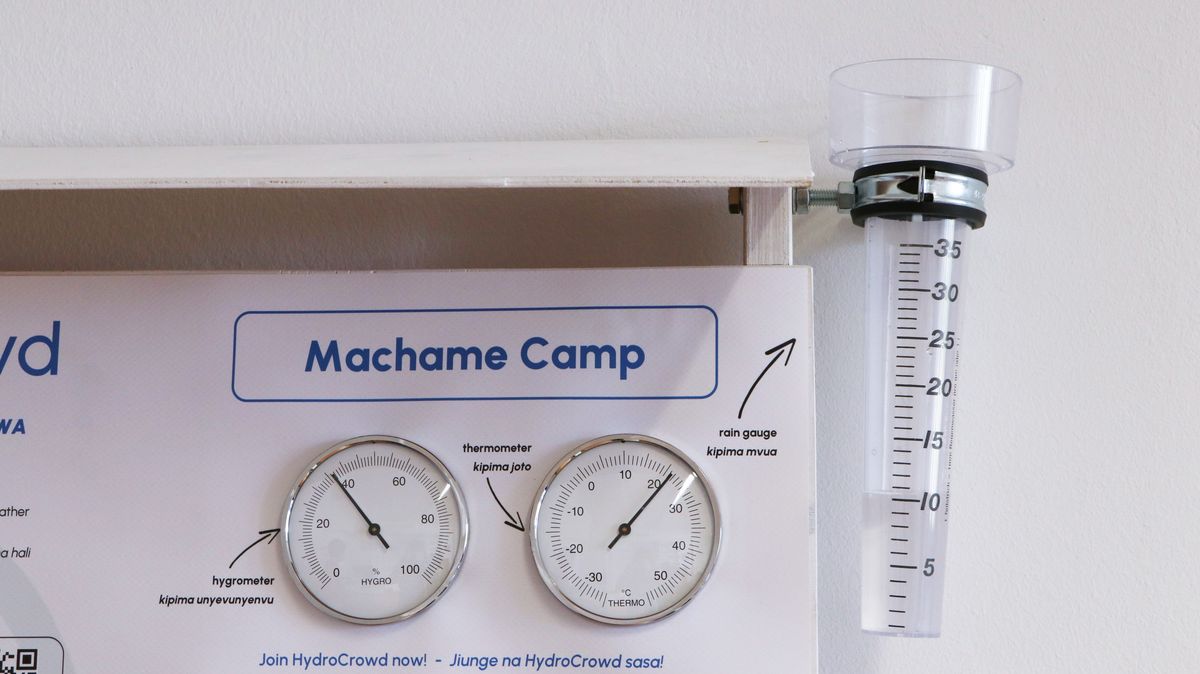
1.) ¿Está en una estación meteorológica?
Saque una foto del panel informativo. Asegúrese de que es posible leer los valores del termómetro, higrómetro y pluviómetro en la foto (ver ejemplo más abajo)
2.) ¿Se encuentra en una estación hidrológica?
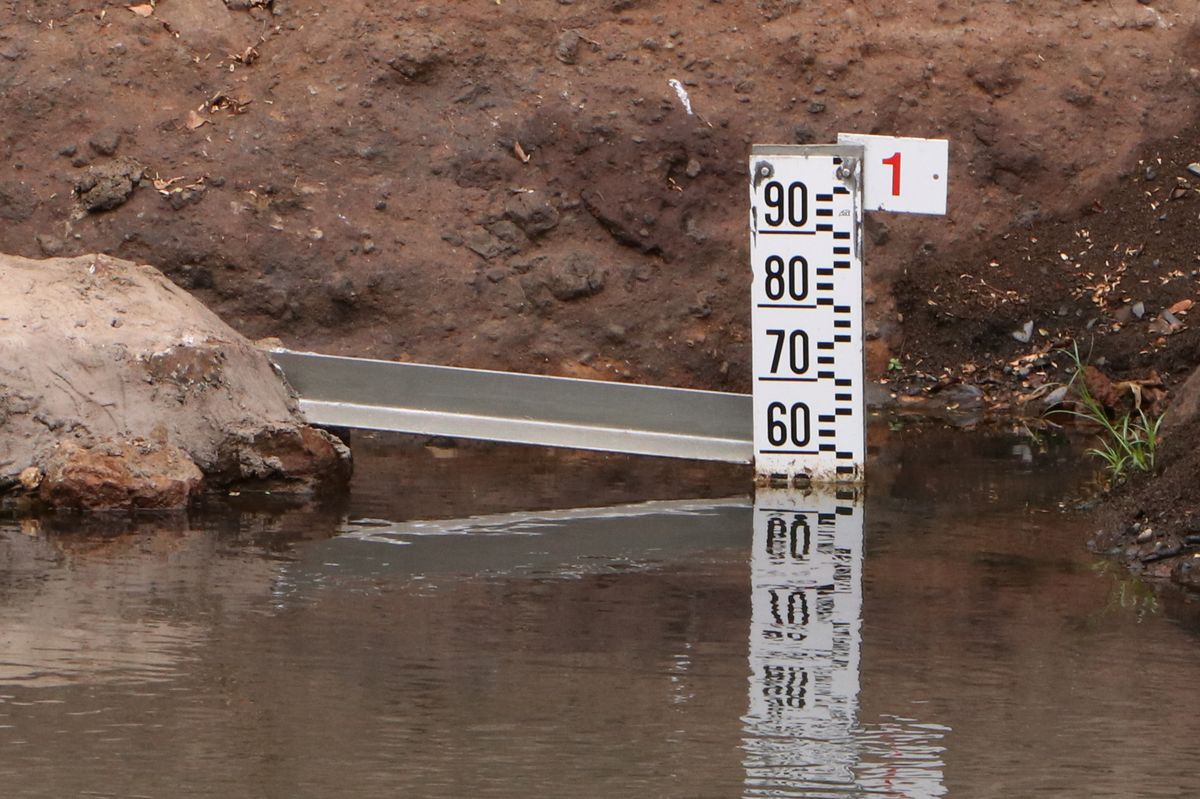
Saque una foto del indicador del nivel de agua en el agua (ver ejemplo más abajo) y asegúrese de que es posible leer el valor del indicador del nivel de agua en la foto. Tenga en cuenta que el indicador del nivel de agua de la estación puede tener un aspecto ligeramente distinto al del ejemplo.
3.) ¿Desea informar desde su estación "Tiempo en Casa"?
- Saque una foto de su pluviómetro (ver ejemplo más abajo) y asegúrese de que es posible leer el valor fácilmente.
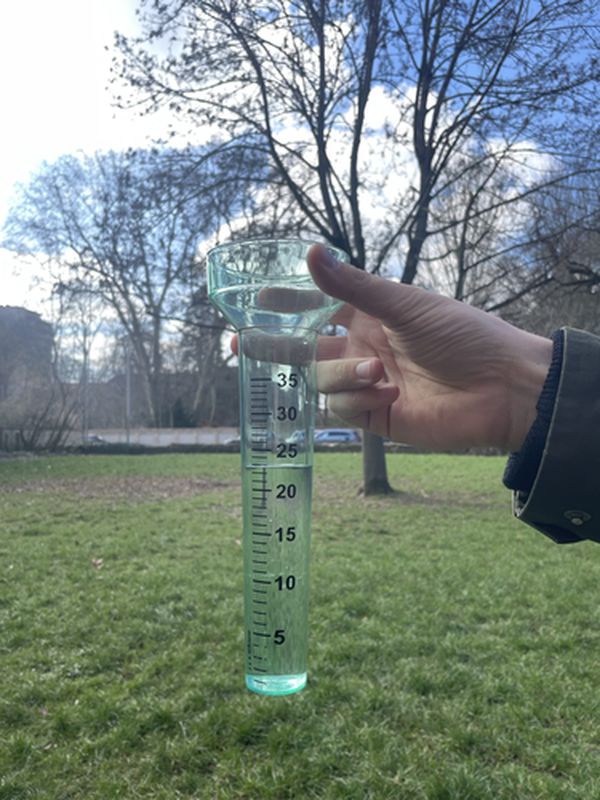
4.) ¿Desea informar con una Foto Nota?
Con ellas puede compartir fotos de cualquier tipo de fenómeno meteorológico, por ejemplo una tormenta de granizo, una inundación o el cauce seco de un río. Aquí tiene algunos ejemplos:
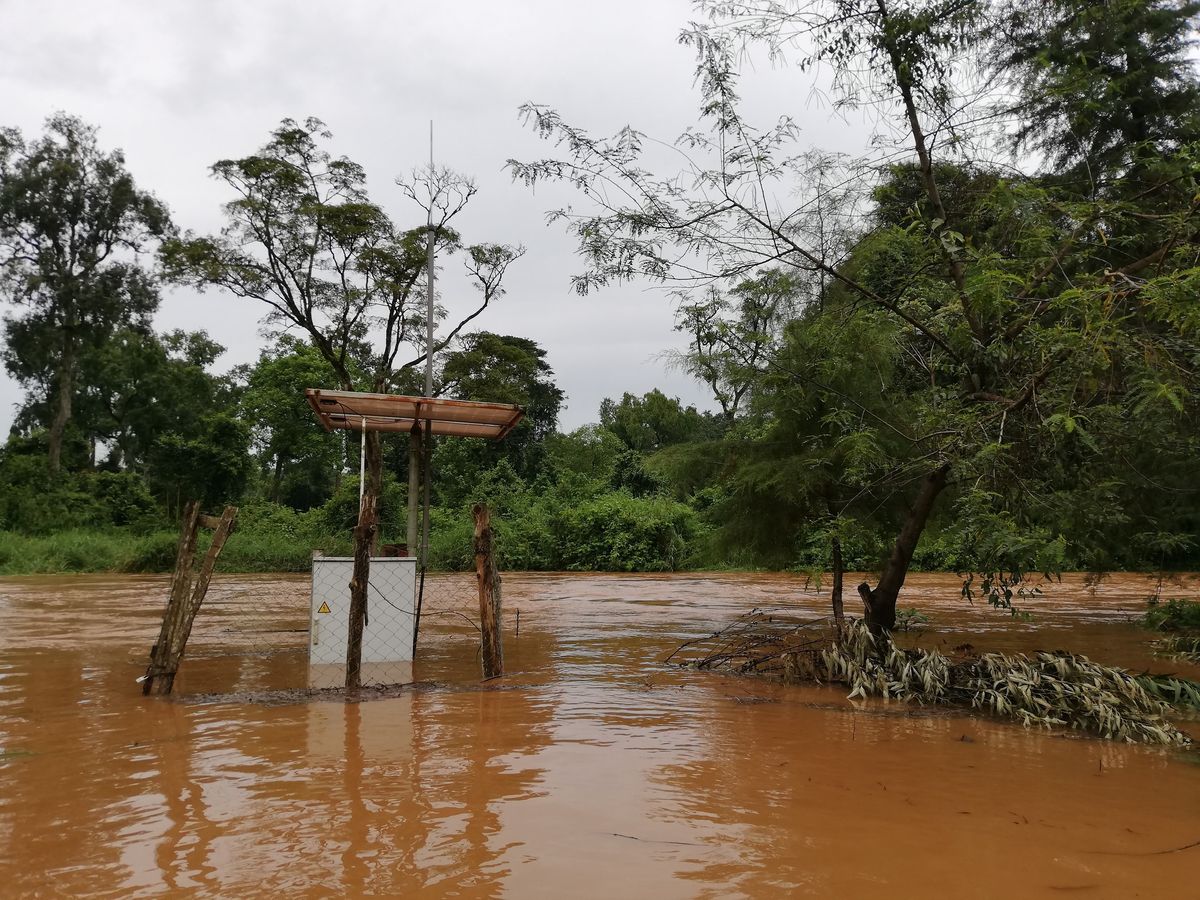
En la foto de arriba se puede ver un río inundado.
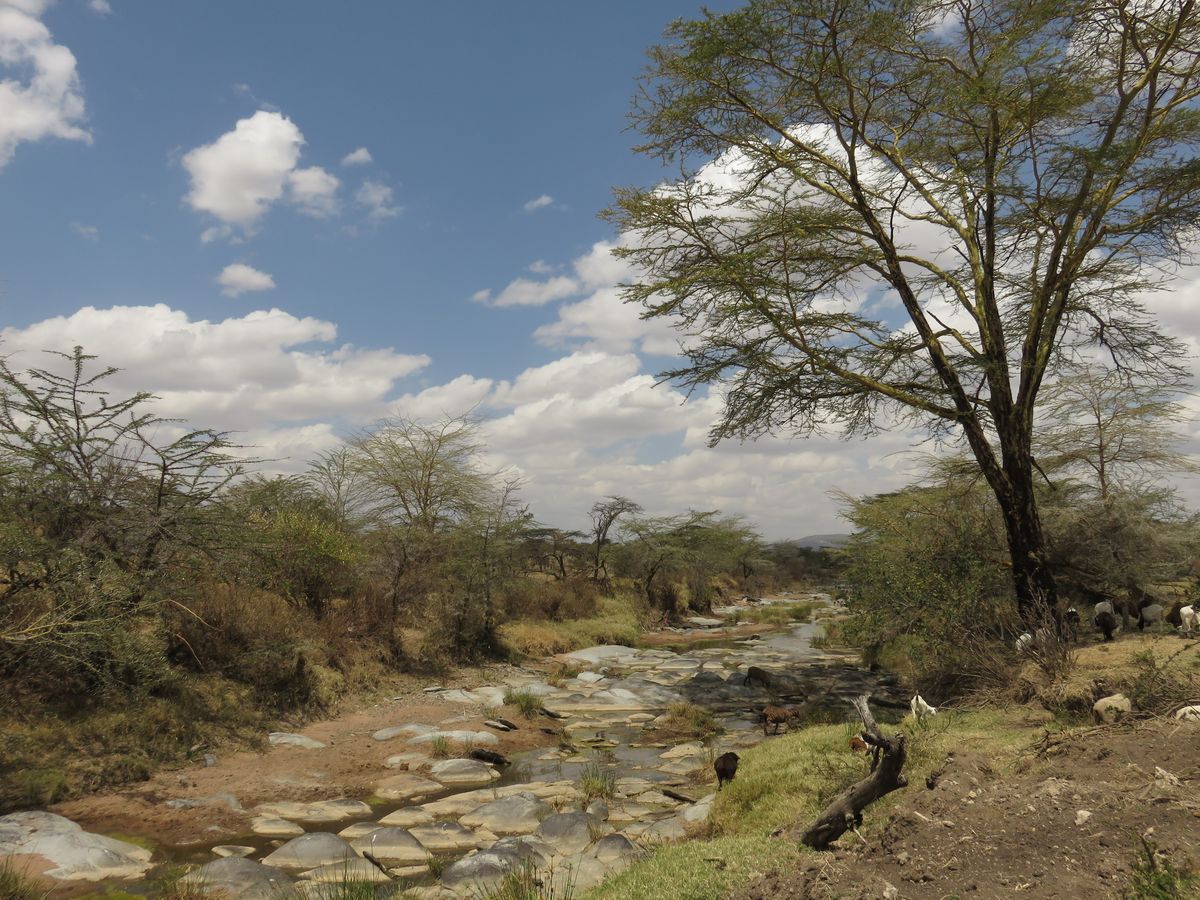
En la foto de arriba se ve un río casi seco.
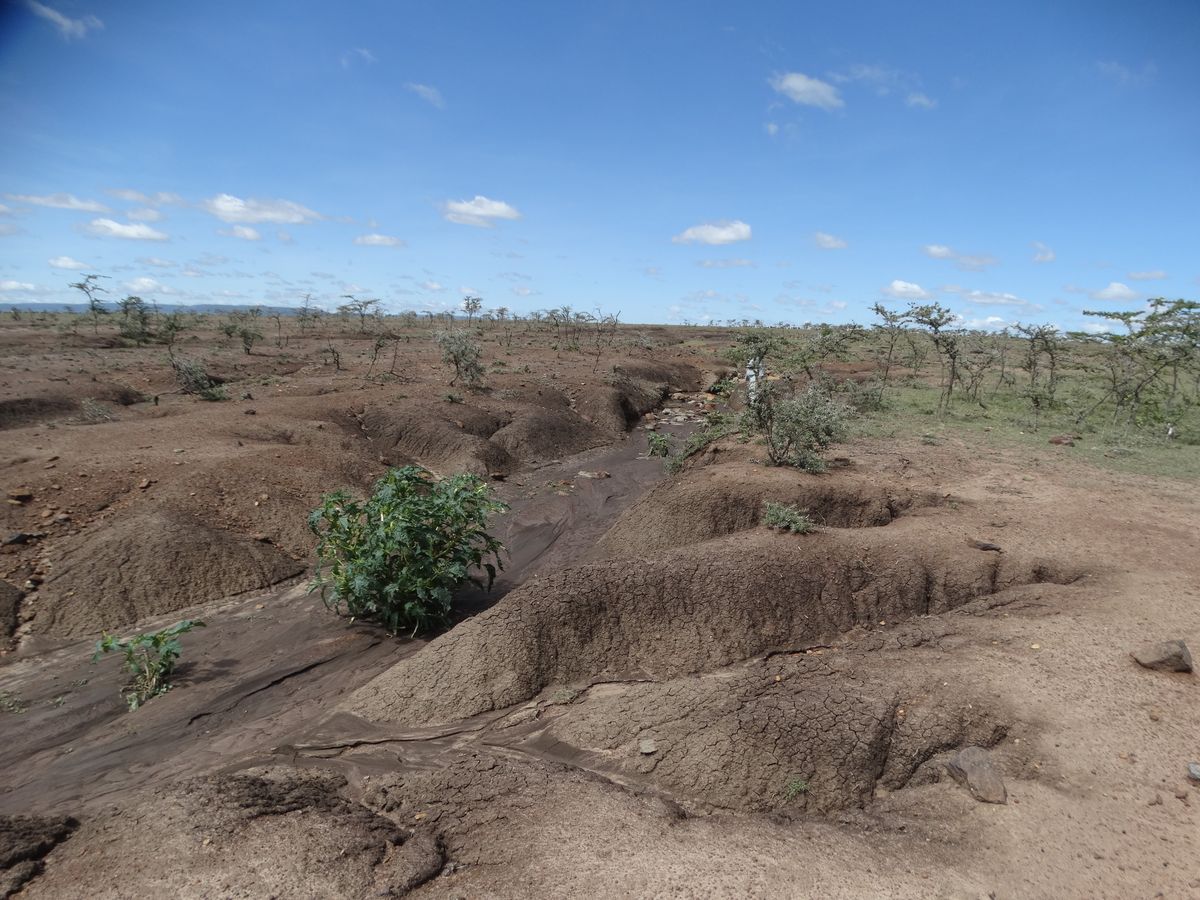
En la foto de arriba puede ver el suelo considerablemente erosionado (la lluvia a lavado parcialmente el suelo)
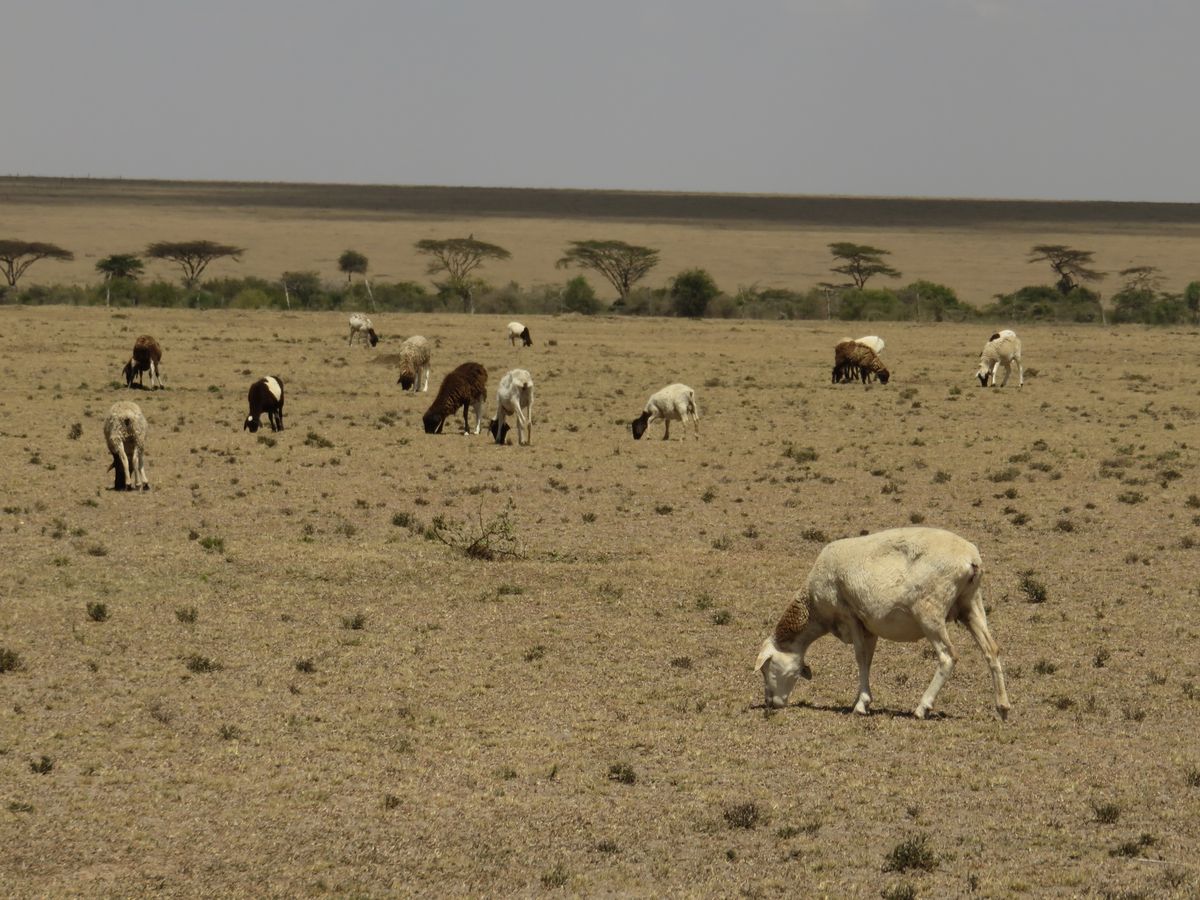
En la foto de arriba puede ver un evento de sequía.
¿Qué tipo de datos desea agregar?
Puede elegir entre cuatro tipos de estación diferentes:
Estación meteorológica: En esta estación se pueden medir diferentes variables meteorológicas como precipitación, temperatura del aire y humedad. Esto sólo se puede hacer en las estaciones ya existentes de HydroCrowd.
Estación hidrológica: En esta estación se puede medir el nivel del agua y la turbiedad del agua del río. Esto sólo se puede hacer en las estaciones ya existentes de HydroCrowd.
Tiempo en Casa: Cree su propio punto y proporcione información meteorológica de su pluviómetro en casa.
Foto Nota: Suba una foto de una observación meteorológica o hidrológica desde el punto que desee.
What kind of data would you like to add?
You can choose between four different station types:
- Weather station: At this station, you can measure of different weather variables like rainfall, air temperature, humidity, and wind. This can only be done at existing HydroCrowd stations.
- Water station: At this station, you can measure the water level and turbidity of the river water. This can only be done at existing HydroCrowd stations.
- Weather@Home: Create your own spot and provide weather information from your rain gauge at home.
- Photo Note: Upload a photo of a weather or water observation from any location you like."
¿Cómo medir la turbiedad?
La turbiedad puede medirse con un tubo de turbidez (ver la siguiente imagen).

El tubo tiene una escala en un lado. Los valores más altos indican que hay más partículas disueltas en el agua y que es menos clara. En términos de calidad del agua, cuanto menor sea el valor, mejor.
Para medir la turbiedad son necesarios varios pasos:
En primer lugar, se debe llenar con agua del río la jarra o el cubo fijado a la estación con. Intente recoger agua de la superficie del río y no del fondo.
A continuación, vierta un poco de agua en el tubo de turbidez hasta que alcance la primera marca (ver la foto de ejemplo abajo).
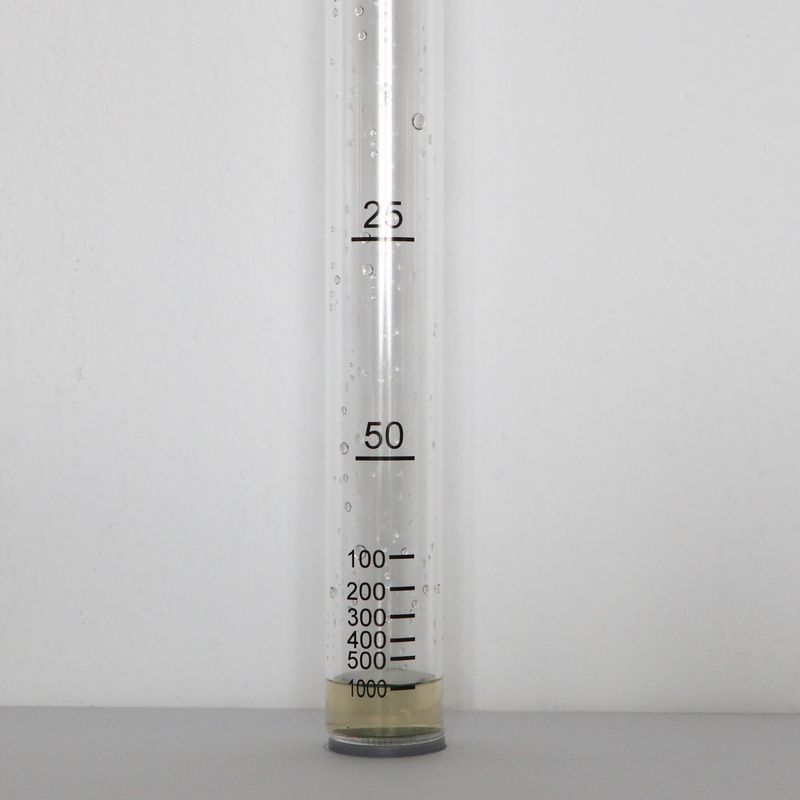
Ahora mire dentro del tubo de turbidez desde arriba. Puede ver el círculo verde en el fondo del tubo?
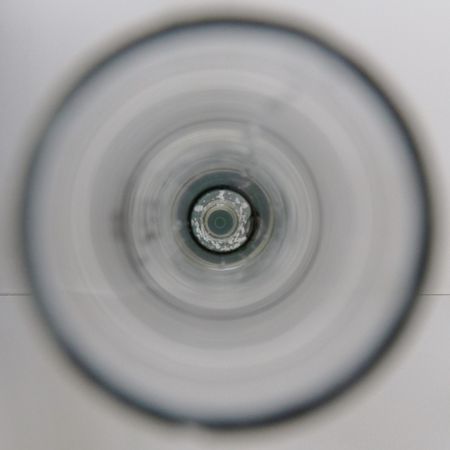
Si ya no puede ver el círculo verde, lea el valor en la marca más baja del tubo e introduzca el valor en el campo correspondiente de la aplicación HydroCrowd. Si el círculo verde sigue visible, llene el tubo hasta la siguiente marca. Repite el proceso hasta que ya no pueda ver más el círculo verde.
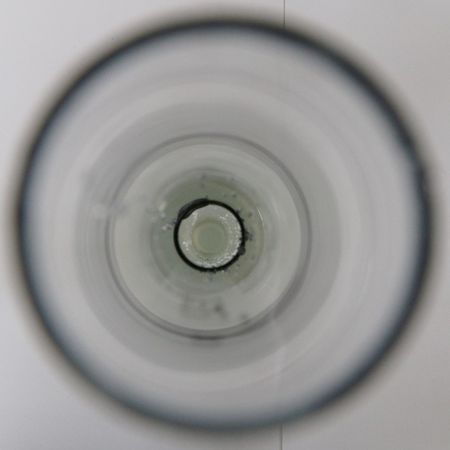
Introduzca el valor en la aplicación cuándo el círculo ya no sea visible.
¿Cómo leer el indicador del nivel de agua?
Un indicador de nivel de agua (regleta) puede utilizarse para medir el nivel del agua en un río o quebrada.
Realizando mediciones periódicas, se pueden registrar los cambios del nivel del agua a lo largo del tiempo. La escala del indicador del nivel del agua está en centímetros (cm). Este es un tipo de indicador del nivel del agua, en el que cada marca tiene 1 centímetro de ancho:
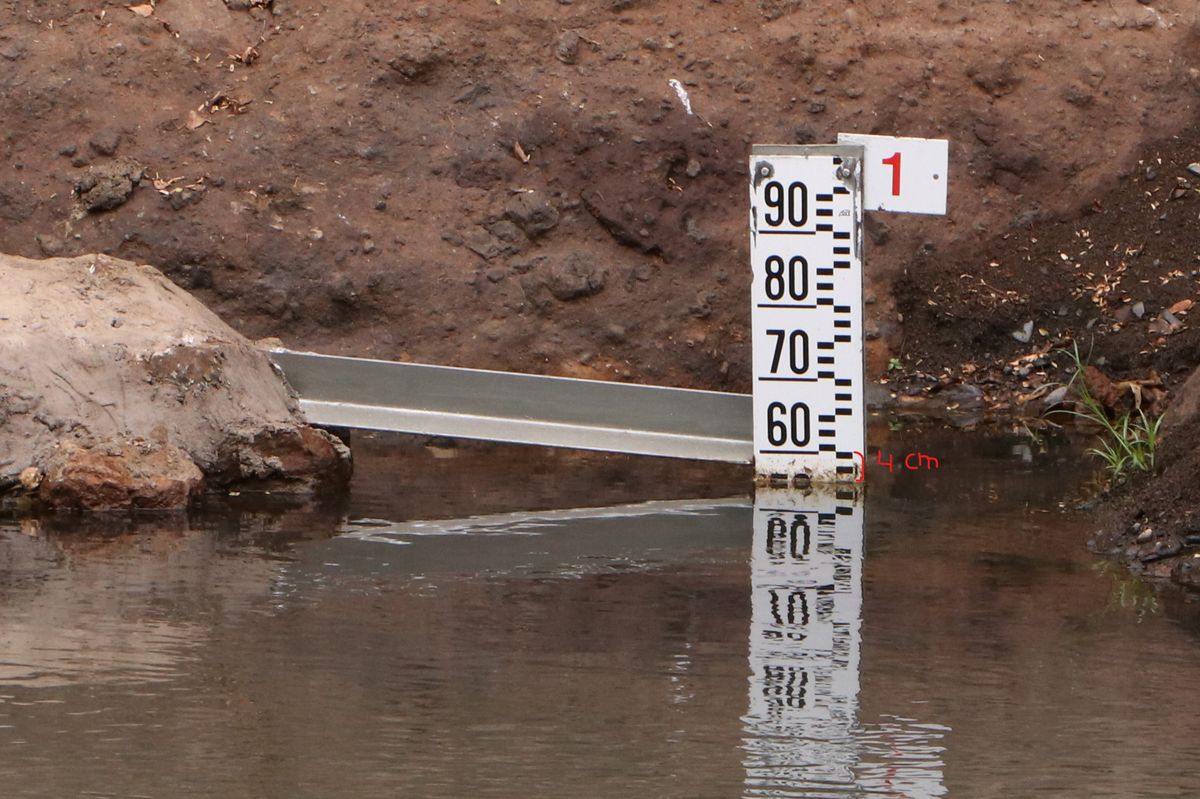
En este ejemplo, el nivel de agua es de 56 cm (4 cm debajo de 60). Este es el valor que debes ingresar en la aplicación como “Nivel de agua”.
En el caso de que el nivel del agua de un río pueda subir por encima de 1 metro (100 cm), serán montados varios medidores de nivel de agua uno encima del otro o en diagonal:
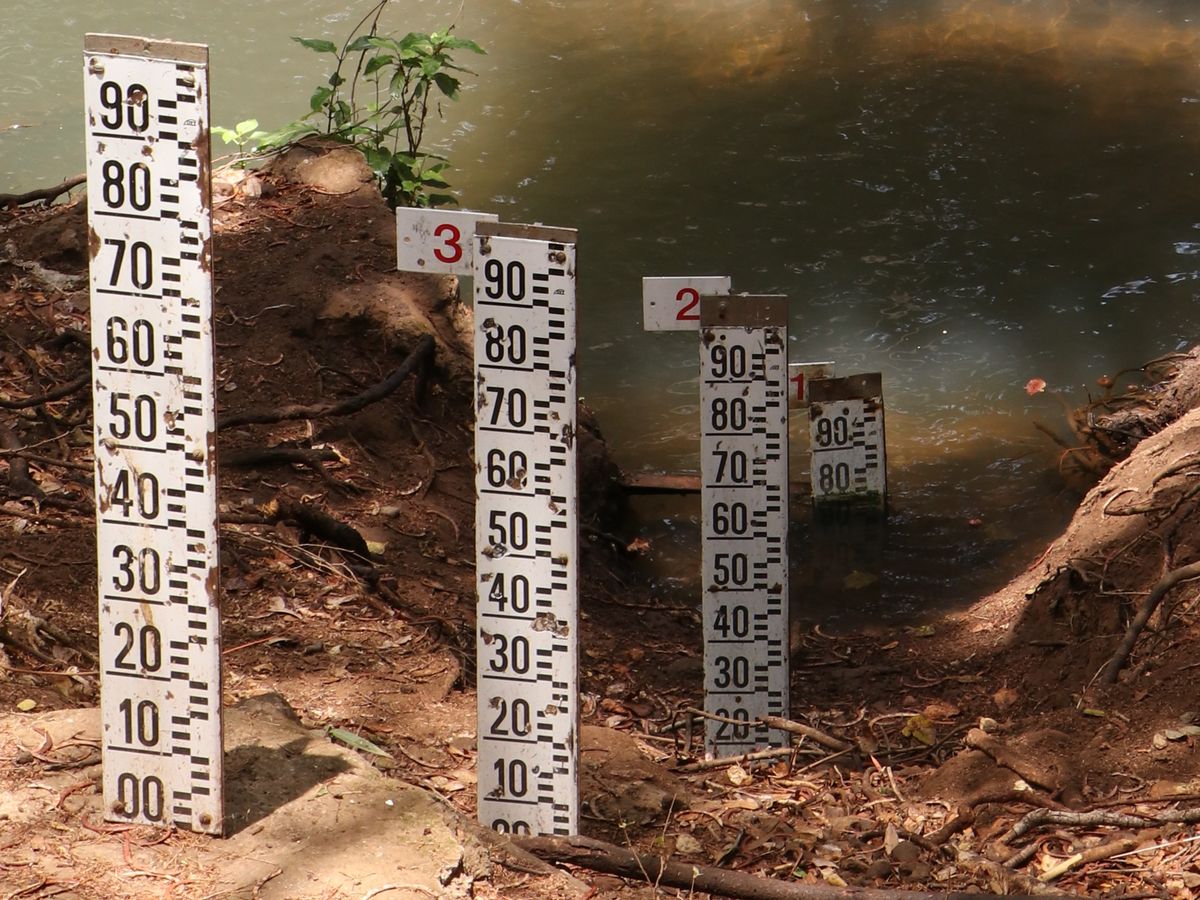
A continuación, el número de la parte superior te indicará en metros el nivel máximo de agua que puede medirse en ese indicador en concreto. En el ejemplo anterior, es 1 m. Este es el valor que introduces como "Número de regleta" en la aplicación.
How to measure turbidity
Turbidity can be measured with a turbidity tube (see image below).

The tube has a scale on the side. Higher values indicate that more particles are dissolved in the water and that it its less clear. In terms of water quality, the lower the value the better.
To measure the turbidity several steps are necessary:
First fill the bucket attached to the chain with water from the river. Try to collect water from the surface of the river and not from the river bed.
Then pour a little bit of water into the turbidity tube until it reaches the first mark (see sample photo below).

Now look into the turbidity tube from the top. Can you see the green circle at the bottom of the tube?

-If you can't see the green circle anymore, read the value at the lowest mark on the tube and enter the value in the appropriate field in the HydroCrowd app. If the green circle is still visible, fill the tube until the next mark. Repeat the process until you can't see the green circle anymore.

Enter the value in the application where the circle is no longer visible.
How to read the water level gauge
A water level gauge can be used to measure the water level in a river. By taking regular measurements, you can record the changes in water level over time. The scale on the water level gauge is in centimeters (cm). This is one type of water level gauge, where each mark is 1 centimeter wide:

In this example, the water level is 56 cm (4 cm below 60). This is the value you enter as 'Water level value' in the app.
In the case that the water level of a river can rise above 1 meter (100 cm), several water level gauges will be mounted on top or diagonally above each other:

Then the number on top will tell you the maximum water level that can be measured at that particular gauge in meters. In the example above, it is 1 m. This is the value you enter as the 'Gauge number' in the app.
How to measure humidity
The hygrometer (see example below) measures how moist the air is at a certain location. This is also called relative humidity.
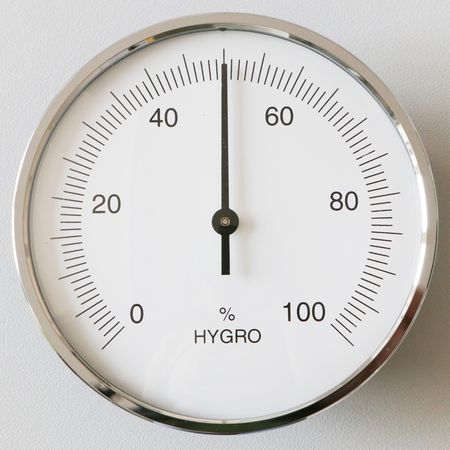
It can measure the humudity from 0 % (completly dry) to 100% (very humid). The scale on the hygrometer is divided into intervals of 1% (short marks) and 5% (long marks). The mark closest to the pointer is the current humidity. In the example above the humidity is 50%.
How to measure temperature
The thermometer measures the air temperature at a certain location. The thermometer at this station measures temperatures from -35 to 55 degrees Celsius (°C) (see example below).
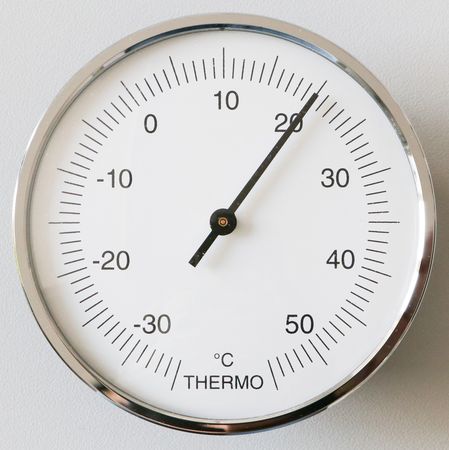
When the temperature is negative (below 0°) it is freezing. The scale on the thermometer is divided into intervals of 1°C (short marks) and 5°C (long marks). The mark closest to the pointer is the current temperature. In the example above the temperature is 20°C.
How to measure rainfall
Rainfall at a certain location is measured with a rain gauge. At the station, the rain gauge is mounted on the right side of the info board (see example below).
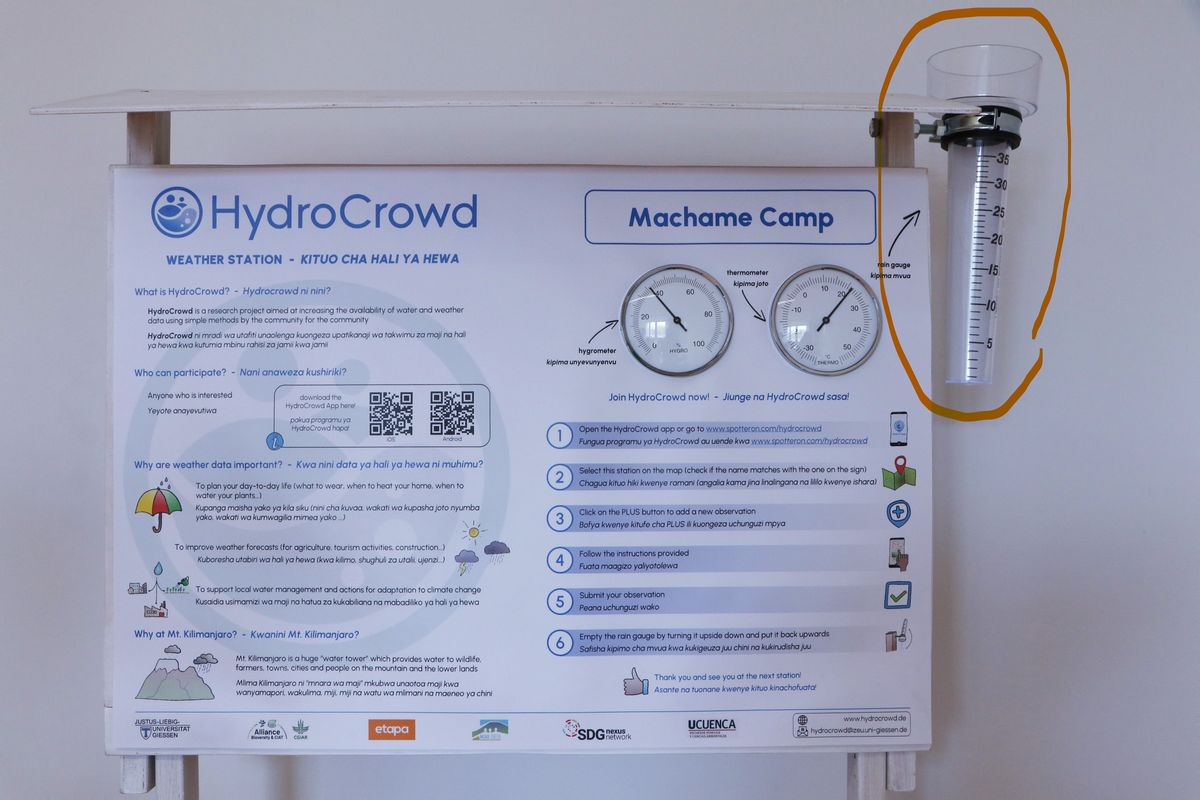
Rainfall is measured in millimeters (mm). The scale on the side of the rain gauge indicates how much rain fell since the last time the rain gauge was emptied. The scale is divided into intervals of 1 mm (short marks) and 5 mm (long marks). Look at the water in the rain gauge. Position yourself, such that your eyes are at the same height as the water level in the rain gauge (see example below).
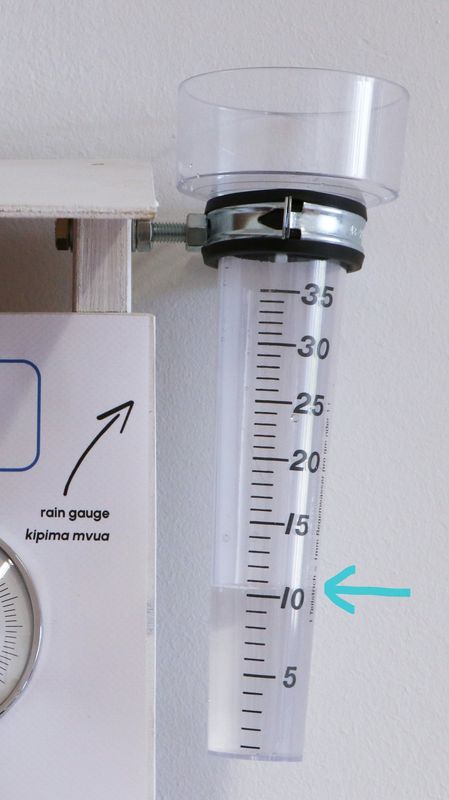
The mark closest to the water level in the rain gauge is the amount of rainfall. In the example above the rainfall is 10 mm. After submitting your rainfall measurement, don't forget to empty the rain gauge by turning it upside down and afterward turning it back with the inlet facing toward the sky (like it is in the first image).
Please visit the website about the SPOTTERON Platform on www.spotteron.net
This website uses no external trackers, no analytics, just session cookies and values your online privacy.

